Every once in a while, you will encounter ABAP programs taking too long to run. Your duty, as an ABAP developer, is to find the bottleneck. Sometimes it is as easy as debugging the program just once, or even just looking at the code. Sometimes not.. This is where SAT comes in. It is a useful tool which helps us to find out which statement or procedure is running for too long.
Here is a test report that will help us to get to know SAT..
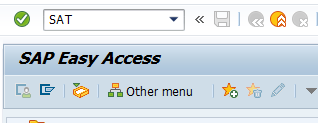
Before running the report, we call transaction SAT..
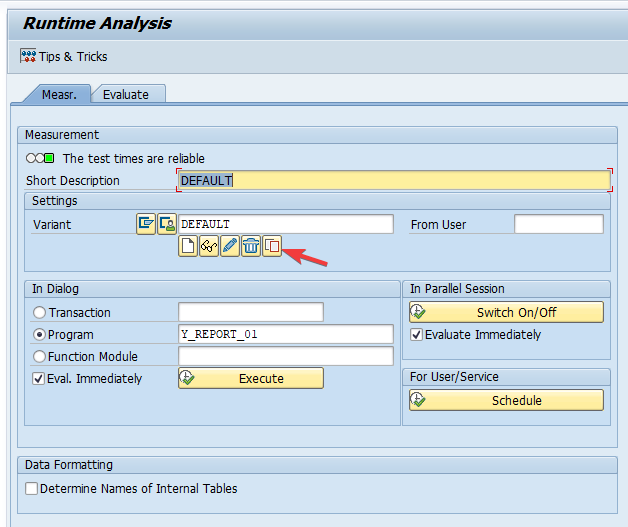
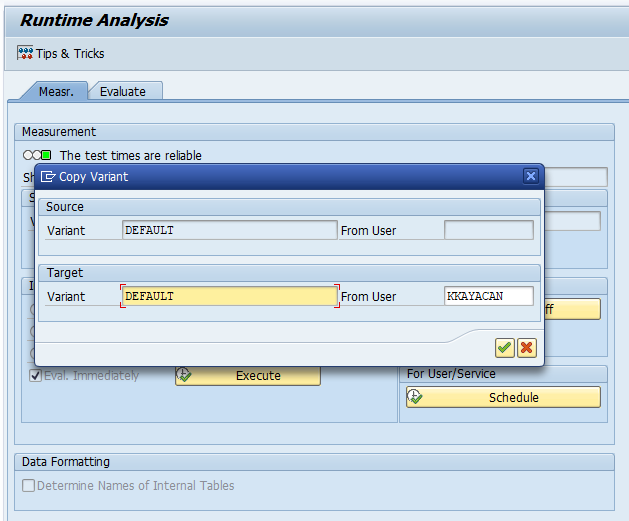
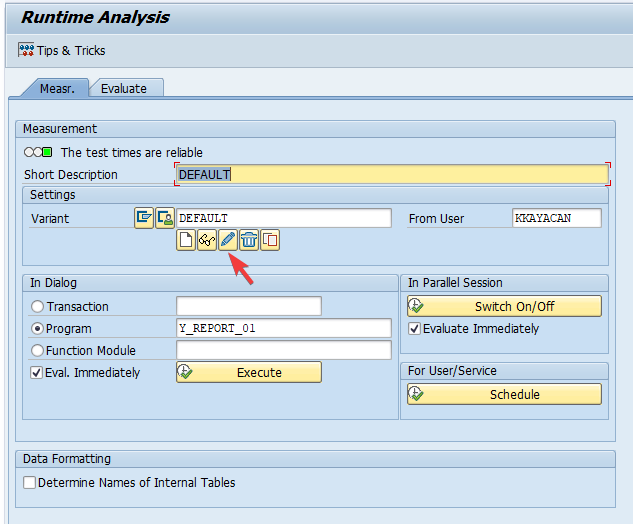
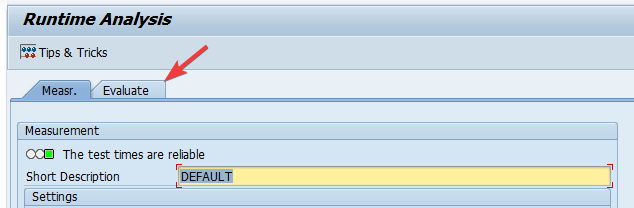
Analysis tool starts with this screen. Before executing analysis, we might need some change with settings. Click copy button in settings section to create a new variant.
We are asked a new name for our settings variant. Same name ‘DEFAULT’ can be used since the user is changing. Confirm the dialog after you are done.
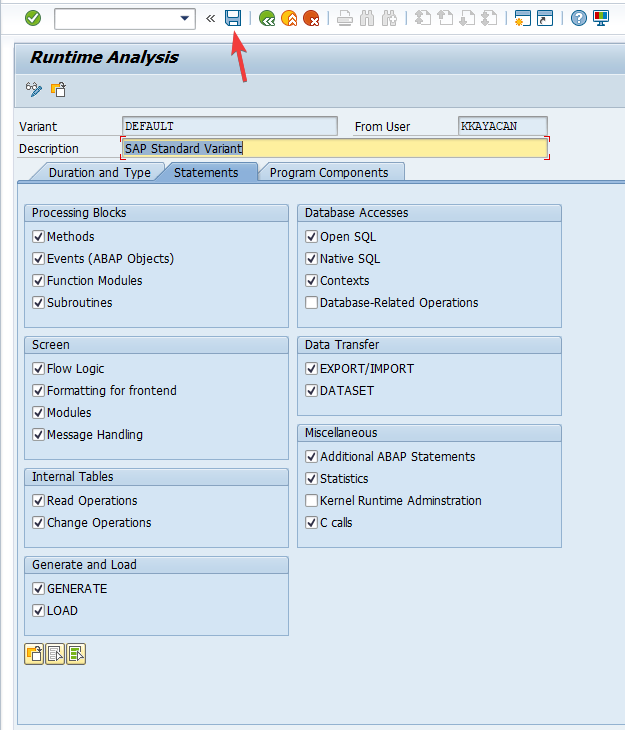
Now we are ready to change our new variant. Click edit button.
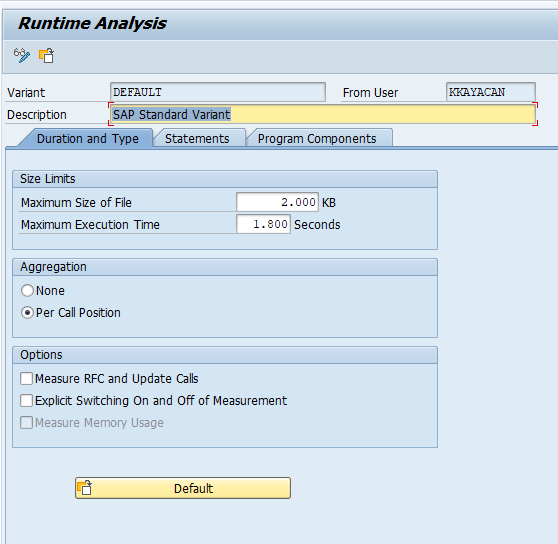
Duration and Type tab looks fine. If you have a report that runs for more than 30 minutes you can change maximum execution time.
Statements tab has more options. With default settings, SAT focuses on database operations and does not measure internal table operations. Sometimes read, loop and collect statements take considerable time if the code is not well-written.
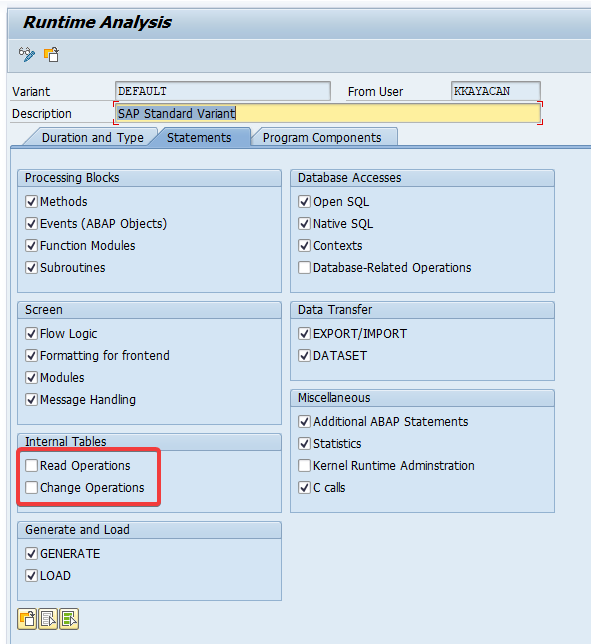
So enable those options and click save.
Now we are ready to start analysis. Enter transaction code, program name or function module name and click execute.
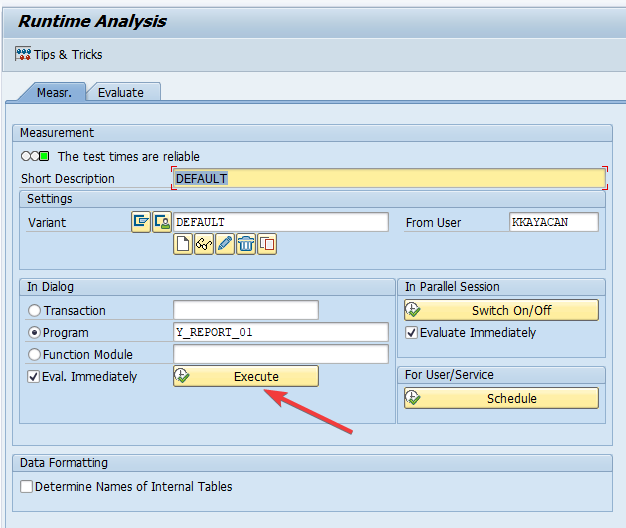
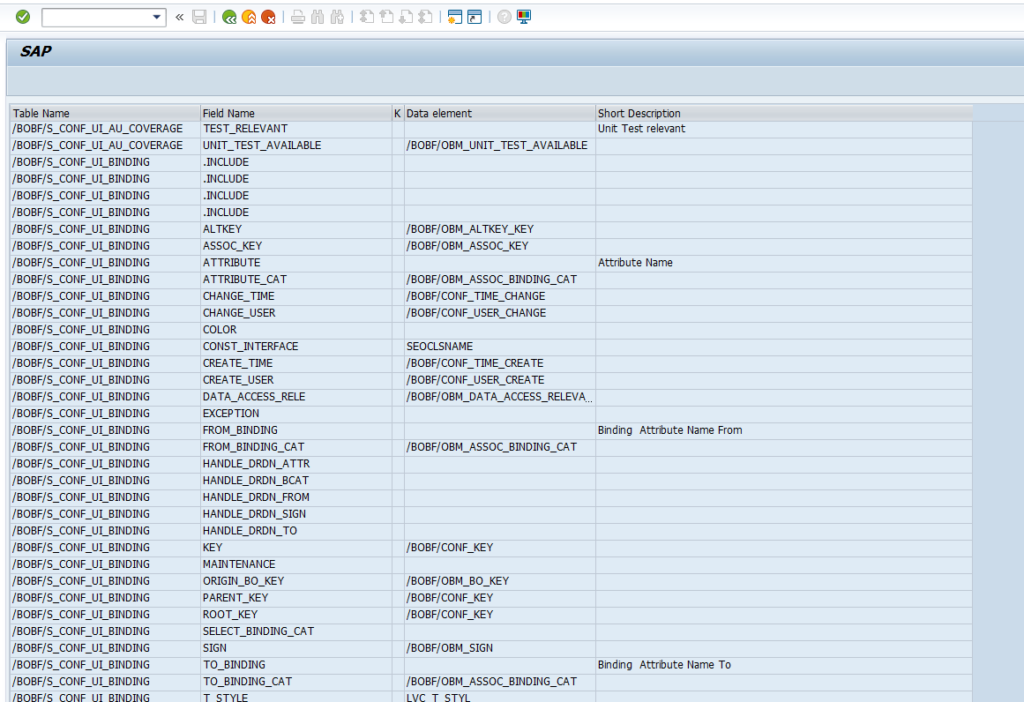
After you click execute, your program starts to run. You will see all selection screens, dialogs and output as always and enter any input you like. SAT does not measure time passed waiting for user interaction. Our test report produces an ALV grid.
Hit back button to leave the report and SAT will build a result screen with two panes. Since right pane is the useful part, just close the left pane with cross icon.
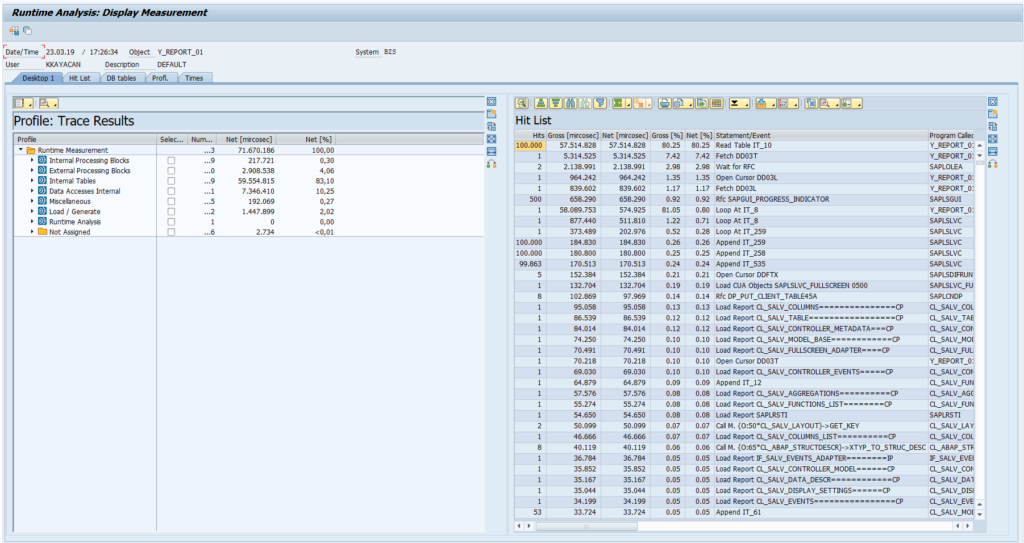
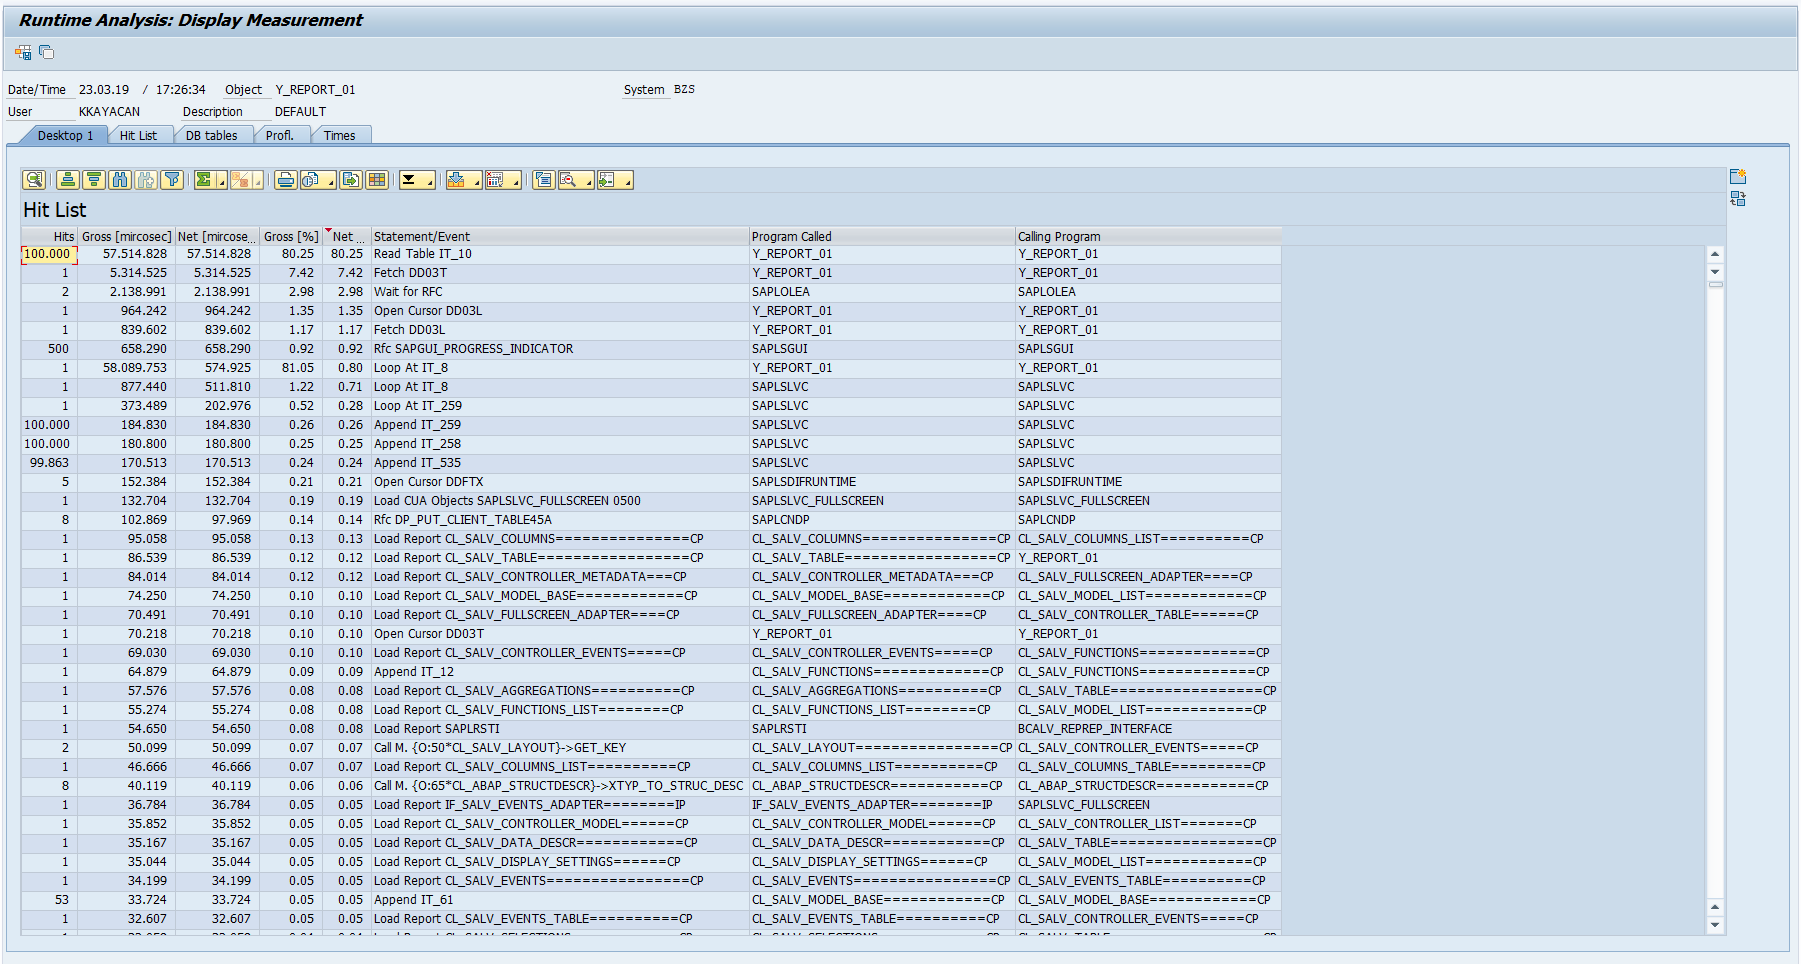
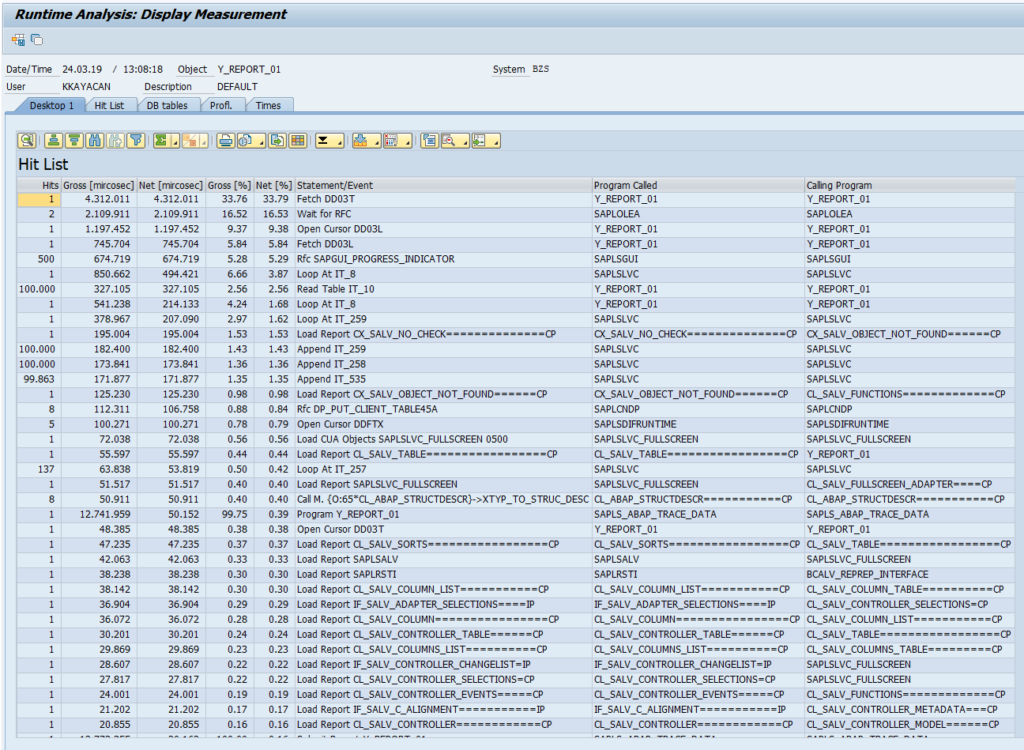
Let’s look closer at the result report. Each row in the report is a statement in our program. Those statements might be database access or internal table operations as well as method, function or subroutine calls. First column (Hits) is the count of how many times the program reached that statement. You might have guessed that statements having a high hit count has run in a loop. Next two columns (Gross [microsec] and Net [microsec]) are the actual time in microseconds (one millionth of a second) spent on that statement. Gross time includes the time spent on inner statements while net time does not. Gross time of a loop is the whole time spent on the loop from start to finish. Net time is only processing time to determine which internal table rows will be looped over. So, a loop with a where condition on an unsorted table might raise net time. What is done inside the loop is irrelevant here. That just affects gross time. Similarly, gross time for a procedure (method, function, subroutine) is the whole time spent on it from start to finish. Net time is only entry and exit processing (like assigning or clearing memory areas for parameters and local variables) of the procedure. So, as a rule of thumb, you should look at gross time for procedures and net time for individual statements to evaluate the result. Next two columns, Gross [%] and Net [%] are like previous two columns, but they give percentile fraction of whole programs processing time instead of duration. You can see statement information on following columns. Double clicking on a row will bring us corresponding statement in ABAP editor.
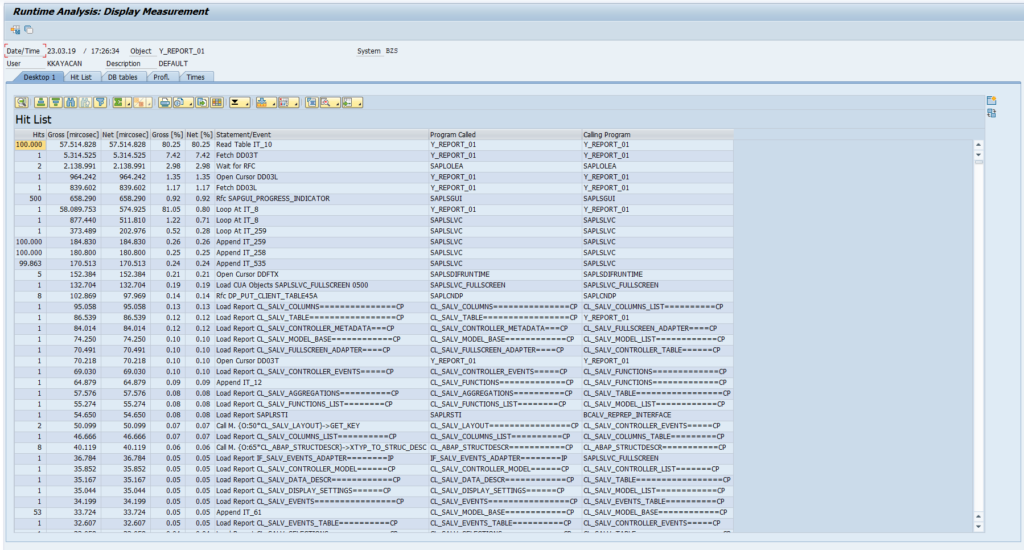
Descending sort on column Net [%] will probably point us where to look first. This is an internal table read, it has run 100.000 times and took %80 of all time.
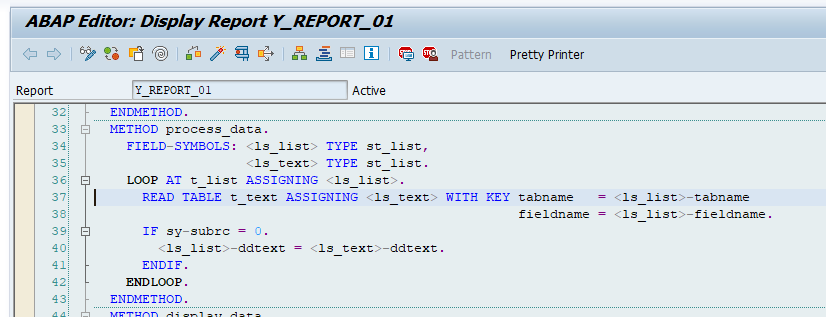
Double click on the row and examine the statement. We are accessing a large standard internal table without binary search.
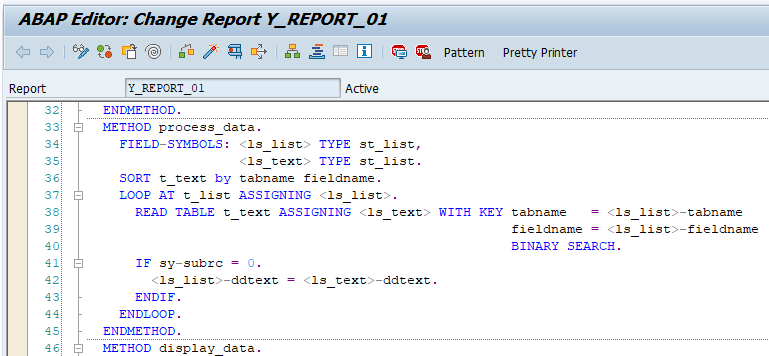
Let’s fix our code. Sort the table and add BINARY SEARCH to read statement.
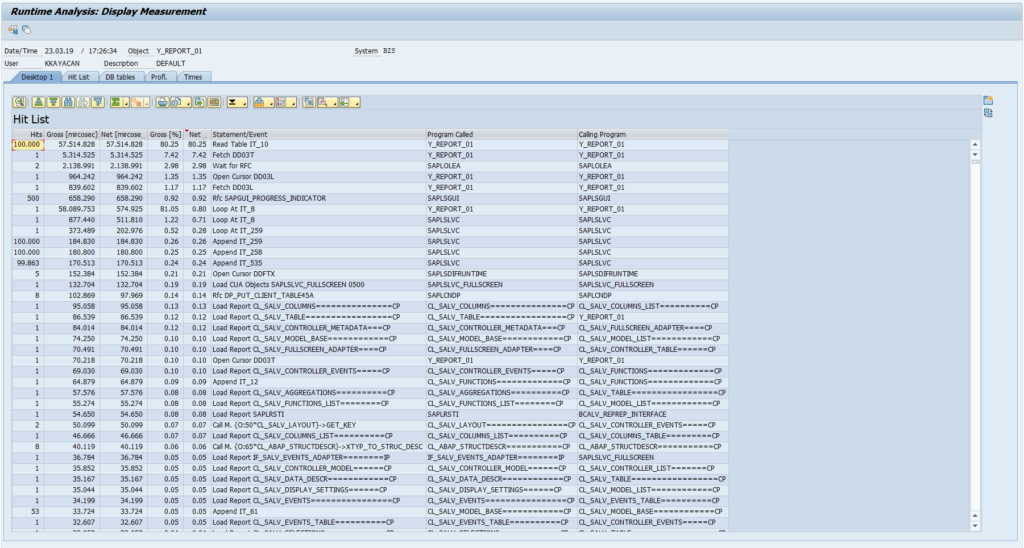
After running our report with SAT for a second time, we will see that fixed read statement is no longer on top of the list.
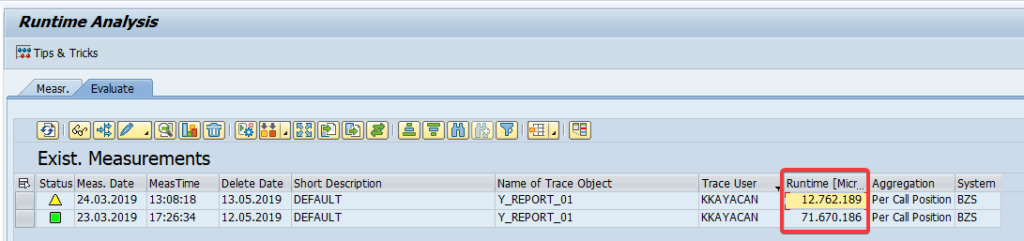
You can also compare results of different executions in evaluate tab of first screen in SAT.
Total time of each measurement can be seen in “Runtime” column. You can double click on any row to examine each analysis in detail. Keep in mind that those results will not remain there forever.